How to benchmark Droonga with Groonga?
- The goal of this tutorial
- Precondition
- Why benchmarking?
- Prepare environments for benchmarking
- Prepare request patterns
- Run the benchmark
- Analyze the result
- Conclusion
The goal of this tutorial
Learning steps to benchmark a Droonga cluster and compare it to a Groonga server.
Precondition
- You must have basic knowledge and experiences to set up and operate an Ubuntu or CentOS Server.
- You must have basic knowledge and experiences to use the Groonga via HTTP.
- You must have basic knowledge to construct a Droonga cluster. Please complete the “getting started” tutorial before this.
Why benchmarking?
Because Droonga has compatibility to Groonga, you’ll plan to migrate your application based on Groonga to Droonga. Before that, you should benchmark Droonga and confirm that it is better alternative for your application.
Of course you may simply hope to know the difference in performance between Groonga and Droonga. Benchmarking will make it clear.
How visualize the performance?
There are two major indexes to indicate performance of a system.
- response time
- throughput
Response time is the actual elapsed time between two moments: when the system receives a request, and when it returns a response. In other words, for clients, it is the time to wait for each request. At this index, the smaller is the better. In general, response time becomes small for lightweight queries, small size database, or less clients.
Throughput means how many request can be processed in a time. The performance index is described as “queries per second (qps)”. For example, if a Groonga server processed 10 requests in one second, that is described as “10qps”. Possibly there are 10 users (clients), or, there are 2 users and each user opens 5 tabs in his web browser. Anyway, “10qps” means that the Groonga actually accepted and responded for 10 requests while one second is passing.
You can run benchmark with the command drnbench-request-response, introduced by the Gem package drnbench.
It measures both response time and throughput of the target service.
How the benchmark tool measures the performance?
drnbench-request-response benchmarks the target service, by steps like following:
- The master process generates one virtual client. The client starts to send many requests to the target sequentially and frequently.
- After a while, the master process kills the client. Then he calculates minimum, maximum, and average elapsed time, from response data. And, he counts up the number of requests actually processed by the target, and reports it as “qps” of the single client case.
- The master process generates two virtual clients. They starts to send requests.
- After a while, the master process kills all clients. Then minimum, maximum, and average elapsed time is calculated, and total number of processed requests sent by all clients is reported as “qps” of the two clients case.
- Repeated with three clients, four clients … and more progressively.
-
Finally, the master process reports minimum/maximum/average elapsed time, “qps”, and other extra information for each case, as a CSV file like:
n_clients,total_n_requests,queries_per_second,min_elapsed_time,max_elapsed_time,average_elapsed_time,0,200
1,164,5.466666666666667,0.002184631,1.951960432,0.1727086823963415,0,100.0
2,1618,53.93333333333333,0.001466091,1.587372312,0.026789948272558754,0.12360939431396785,99.87639060568603
4,4690,156.33333333333334,0.001065161,0.26070575,0.015224578191897657,0.042643923240938165,99.95735607675907
6,6287,209.56666666666666,0.000923332,0.25709169,0.018191428254970568,0.09543502465404805,99.90456497534595
8,6628,220.93333333333334,0.000979707,0.288406006,0.02557014875603507,0.030175015087507546,99.96982498491249
10,7117,237.23333333333332,0.001235846,0.303093461,0.03160425060474918,0.1405086412814388,99.85949135871857
12,7403,246.76666666666668,0.001111115,0.33163911,0.03792291040199917,0.09455626097528029,99.90544373902472
14,7454,248.46666666666667,0.00151987,0.335161281,0.04522922885028168,0.174403005097934,99.82559699490207
16,7357,245.23333333333332,0.000763487,0.356862003,0.05435767224085904,0.08155498165012913,99.91844501834987
18,7494,249.8,0.001017168,0.378661333,0.061178927504003194,0.20016012810248196,99.79983987189752
20,7506,250.2,0.001759464,0.404634447,0.06887332192845741,0.21316280309086064,99.78683719690913
You can analyze it, draw a graph from it, and so on.
(Note: Performance results fluctuate from various factors. This is just an example on a specific version, specific environment.)
How read and analyze the result?
Look at the result above.
Elapsed response time is easily analyzed - the smaller is the better. The minimum and average response time becomes small if any cache system is working correctly on the target. The maximum time is affected by slow queries, system’s page-in/page-out, unexpected errors, and so on,
See also the last two columns, 0 and 200.
They mean the percentage of HTTP response statuses.
200 is “OK”, 0 is “timed out”.
If clients got 400, 500 and other errors, they will be also reported.
These information will help you to detect unexpected slow down.
(Because in-progress requests are shut down on the end of each case and they are reported as “timed out”, 200 is not 100% in this result.)
To analyze throughput, a graph is useful.
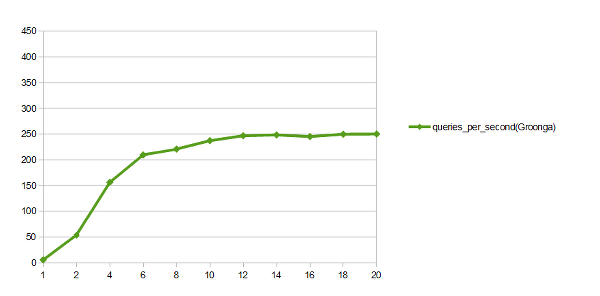
You’ll see that the “qps” stagnated around 250, for 12 or more clients. This means that the target service can process 250 requests in one second, at a maximum.
In other words, we can describe the result as: 250qps is the maximum throughput performance of this system - generic performance of hardware, software, network, size of the database, queries, and more. If the number of requests for your service is growing up and it is going to reach the limit, you have to do something about it - optimize queries, replace the computer with more powerful one, and so on.
And, sending same request patterns to Groonga and Droonga, you can compare response times and maximum “qps” for each system. If Droonga’s “qps” is larger than Groonga’s one (=Droonga has better performance about throughput), it will become good reason to migrate your service from Groogna to Droonga. Moreover, comparing multiple results from different number of Droogna nodes, you can analyze the cost-benefit performance for newly introduced nodes.
Prepare environments for benchmarking
Assume that there are four Ubuntu 14.04LTS servers for the new Droogna cluster and they can resolve their names each other:
192.168.100.50, the host name isnode0192.168.100.51, the host name isnode1192.168.100.52, the host name isnode2192.168.100.53, the host name isnode3
One is client, others are Droonga nodes.
Ensure an existing reference database (and the data source)
If you have any existing service based on Groonga, it becomes the reference. Then you just have to dump all data in your Groonga database and load them to a new Droonga cluster.
Otherwise - if you have no existing service, prepare a new reference database with much data for effective benchmark. The repository wikipedia-search includes some helper scripts to construct your Groonga server (and Droonga cluster), with Japanese Wikipedia pages.
So let’s prepare a new Groonga database including Wikipedia pages, on the node0.
-
Determine the size of the database. You have to use good enough size database for benchmarking.
- If it is too small, you’ll see “too bad” benchmark result for Droonga, because the percentage of the Droonga’s overhead becomes relatively too large.
- If it is too large, you’ll see “too unstable” result because page-in and page-out of RAM will slow the performance down randomly.
- If RAM size of all nodes are different, you should determine the size of the database for the minimum size RAM.
For example, if there are three nodes
node0(8GB RAM),node1(8GB RAM), andnode2(6GB RAM), then the database should be smaller than 6GB. -
Set up the Groonga server, as instructed on the installation guide.
(on node0)
% sudo apt-get -y install software-properties-common
% sudo add-apt-repository -y universe
% sudo add-apt-repository -y ppa:groonga/ppa
% sudo apt-get update
% sudo apt-get -y install groonga
Then the Groonga becomes available.
-
Download the archive of Wikipedia pages and convert it to a dump file for Groonga, with the rake task
data:convert:groonga:ja. You can specify the number of records (pages) to be converted via the environment variableMAX_N_RECORDS(default=5000).(on node0) % cd ~/ % git clone https://github.com/droonga/wikipedia-search.git % cd wikipedia-search % bundle install % time (MAX_N_RECORDS=100000 bundle exec rake data:convert:groonga:ja \ data/groonga/ja-pages.grn)Because the archive is very large, downloading and data conversion may take time.
After that, a dump file
~/wikipedia-search/data/groonga/ja-pages.grnis there. Create a new database and load the dump file to it. This also may take more time:(on node0) % mkdir -p $HOME/groonga/db/ % groonga -n $HOME/groonga/db/db quit % time (cat ~/wikipedia-search/config/groonga/schema.grn | groonga $HOME/groonga/db/db) % time (cat ~/wikipedia-search/config/groonga/indexes.grn | groonga $HOME/groonga/db/db) % time (cat ~/wikipedia-search/data/groonga/ja-pages.grn | groonga $HOME/groonga/db/db)Note: number of records affects to the database size. Just for information, my results are here:
- 1.1GB database was constructed from 300000 records. Data conversion took 17 min, data loading took 6 min.
- 4.3GB database was constructed from 1500000 records. Data conversion took 53 min, data loading took 64 min.
-
Start the Groonga as an HTTP server.
(on node0)
% groonga -p 10041 -d --protocol http $HOME/groonga/db/db
OK, now we can use this node as the reference for benchmarking.
Set up a Droonga cluster
Install Droonga to all nodes.
Because we are benchmarking it via HTTP, you have to install both services droonga-engine and droonga-http-server for each node.
(on node0)
% host=node0
% curl https://raw.githubusercontent.com/droonga/droonga-engine/master/install.sh | \
    sudo HOST=$host bash
% curl https://raw.githubusercontent.com/droonga/droonga-http-server/master/install.sh | \
    sudo ENGINE_HOST=$host HOST=$host PORT=10042 bash
% sudo droonga-engine-catalog-generate \
    --hosts=node0,node1,node2
% sudo service droonga-engine start
% sudo service droonga-http-server start
(on node1)
% host=node1
...
(on node2)
% host=node2
...
Note: to start droonga-http-server with a port number different from Groonga, we should specify another port 10042 via the PORT environment variable, like above.
Make sure that Droonga’s HTTP server is actualy listening the port 10042 and it is working as a cluster with three nodes:
(on node0)
% sudo apt-get install -y jq
% curl "http://node0:10042/droonga/system/status" | jq .
{
  "nodes": {
    "node0:10031/droonga": {
      "live": true
    },
    "node1:10031/droonga": {
      "live": true
    },
    "node2:10031/droonga": {
      "live": true
    }
  }
}
Synchronize data from Groonga to Droonga
Next, prepare the Droonga database.
You can generate messages for Droonga from Groonga’s dump result, by the grn2drn command.
Install grn2drn Gem package to activate the command, to the Groonga server computer.
(on node0)
% sudo gem install grn2drn
And, the grndump command introduced as a part of rroonga Gem package provides ability to extract all data of an existing Groonga database, flexibly.
If you are going to extract data from an existing Groonga server, you have to install rroonga before that.
(on Ubuntu server)
% sudo apt-get -y install software-properties-common
% sudo add-apt-repository -y universe
% sudo add-apt-repository -y ppa:groonga/ppa
% sudo apt-get update
% sudo apt-get -y install libgroonga-dev
% sudo gem install rroonga
(on CentOS server)
# rpm -ivh http://packages.groonga.org/centos/groonga-release-1.1.0-1.noarch.rpm
# yum -y makecache
# yum -y ruby-devel groonga-devel
# gem install rroonga
Then dump schemas and data separately and load them to the Droonga cluster.
(on node0)
% time (grndump --no-dump-tables $HOME/groonga/db/db | \
          grn2drn | \
          droonga-send --server=node0 \
                       --report-throughput)
% time (grndump --no-dump-schema --no-dump-indexes $HOME/groonga/db/db | \
          grn2drn | \
          droonga-send --server=node0 \
                       --server=node1 \
                       --server=node2 \
                       --report-throughput)
Note that you must send requests for schema and indexes to just one endpoint. Parallel sending of schema definition requests for multiple endpoints will break the database, because Droonga cannot sort schema changing commands sent to each node in parallel.
This may take much time.
After all, now you have two HTTP servers: Groonga HTTP server with the port 10041, and Droonga HTTP Servers with the port 10042.
Set up the client
You must install the benchmark client to the computer.
Assume that you use a computer node3 as the client:
(on node3)
% sudo apt-get update
% sudo apt-get -y upgrade
% sudo apt-get install -y ruby curl jq
% sudo gem install drnbench
Prepare request patterns
Let’s prepare request pattern files for benchmarking.
Determine the expected cache hit rate
First, you have to determine the cache hit rate.
If you have any existing service based on Groonga, you can get the actual cache hit rate of the Groonga database via status command, like:
% curl "http://node0:10041/d/status" | jq .
[
  [
    0,
    1412326645.19701,
    3.76701354980469e-05
  ],
  {
    "max_command_version": 2,
    "alloc_count": 158,
    "starttime": 1412326485,
    "uptime": 160,
    "version": "4.0.6",
    "n_queries": 1000,
    "cache_hit_rate": 0.5,
    "command_version": 1,
    "default_command_version": 1
  }
]
The cache hit rate appears as "cache_hit_rate".
0.5 means 50%, then a half of responses are returned from cached results.
If you have no existing service, you should assume that the cache hit rate becomes 50%.
To measure and compare performance of Groonga and Droonga properly, you should prepare request patterns for benchmarking which make the cache hit rate near the actual rate. So, how do it?
You can control the cache hit rate by the number of unique request patterns, calculated with the expression:
N = 100 / (cache hit rate), because Groonga and Droonga (droonga-http-server) cache 100 results at a maximum by default.
When the expected cache hit rate is 50%, the number of unique requests is calculated as: N = 100 / 0.5 = 200
Note: if the actual rate is near zero, the number of unique requests becomes too huge! For such case you should carry up the rate to 0.01 (1%) or something.
Format of request patterns file
The format of the request patterns list for drnbench-request-response is the plain text, a list of request paths for the host.
Here is a short example of requests for Groonga’s select command:
/d/select?command_version=2&table=Pages&limit=10&match_columns=title&output_columns=title&query=AAA
/d/select?command_version=2&table=Pages&limit=10&match_columns=title&output_columns=title&query=BBB
...
If you have any existing service based on Groonga, the list should be generated from the actual access log, query log, and so on. Patterns similar to actual requests will measure performance of your system more effectively. To generate 200 unique request patterns, you just have to collect 200 unique paths from your log.
Otherwise, you’ll have to generate list of request paths from something. See the next section.
Prepare list of search terms
To generate 200 unique request patterns, you have to prepare 200 terms.
Moreover, all of terms must be effective search term for the Groonga database.
If you use randomly generated terms (like P2qyNJ9L, Hy4pLKc5, D5eftuTp, …), you won’t get effective benchmark result, because “not found” results will be returned for most requests.
So there is a utility command drnbench-extract-searchterms.
It generates list of terms from Groonga’s select result, like:
% curl "http://node0:10041/d/select?command_version=2&table=Pages&limit=10&output_columns=title" | \
    drnbench-extract-searchterms
title1
title2
title3
...
title10
drnbench-extract-searchterms extracts terms from the first column of records.
To collect 200 effective search terms, you just have to give a select result with an option limit=200.
Generate request pattern file from given terms
OK, let’s generate request patterns by drnbench-extract-searchterms, from a select result.
% n_unique_requests=200
% curl "http://node0:10041/d/select?command_version=2&table=Pages&limit=$n_unique_requests&output_columns=title" | \
    drnbench-extract-searchterms --escape | \
    sed -r -e "s;^;/d/select?command_version=2\&table=Pages\&limit=10\&match_columns=title,text\&output_columns=snippet_html(title),snippet_html(text),categories,_key\&query_flags=NONE\&query=;" \
    > ./patterns.txt
Note:
- You must escape
&in the sed script with prefixed backslash, like\&. - You should specify the
--escapeoption fordrnbench-extract-searchterms. It escapes characters unsafe for URI strings. - You should specify
query_flags=NONEas a part of parameters, if you use search terms by thequeryparameter. It forces ignoring of special characters in thequeryparameter, to Groonga. Otherwise you may see some errors from invalid queries.
The generated file patterns.txt becomes like following:
/d/select?command_version=2&table=Pages&limit=10&match_columns=title,text&output_columns=snippet_html(title),snippet_html(text),categories,_key&query_flags=NONE&query=AAA
/d/select?command_version=2&table=Pages&limit=10&match_columns=title,text&output_columns=snippet_html(title),snippet_html(text),categories,_key&query_flags=NONE&query=BBB
...
Run the benchmark
OK, it’s ready to run. Let’s benchmark Groonga and Droonga.
Benchmark Groonga
First, run benchmark for Groonga as the reference. Start Groonga’s HTTP server before running, if you configured a node as a reference Groonga server and daemon is stopped.
(on node0)
% groonga -p 10041 -d --protocol http $HOME/groonga/db/db
You can run benchmark with the command drnbench-request-response, like:
(on node3)
% drnbench-request-response \
    --step=2 \
    --start-n-clients=0 \
    --end-n-clients=20 \
    --duration=30 \
    --interval=10 \
    --request-patterns-file=$PWD/patterns.txt \
    --default-hosts=node0 \
    --default-port=10041 \
    --output-path=$PWD/groonga-result.csv
Important parameters are:
--stepis the number of virtual clients increased on each progress.--start-n-clientsis the initial number of virtual clients. Even if you specify0, initially one client is always generated.--end-n-clientsis the maximum number of virtual clients. Benchmark is performed progressively until the number of clients is reached to this limit.--durationis the duration of each benchmark. This should be long enough to average out the result.30(seconds) seems good for my case.--intervalis the interval between each benchmark. This should be long enough to finish previous benchmark.10(seconds) seems good for my case.--request-patterns-fileis the path to the pattern file.--default-hostsis the list of host names of target endpoints. By specifying multiple hosts as a comma-separated list, you can simulate load balancing.--default-portis the port number of the target endpoint.--output-pathis the path to the result file. Statistics of all benchmarks is saved as a file at the location.
Then you’ll get the reference result of the Groonga. After that you should stop Groonga to release CPU and RAM resources, if it is running on a Droonga node.
(on node0)
% pkill groonga
Benchmark Droonga
Benchmark Droonga with single node
Before benchmarking, make your cluster with only one node.
(on node0)
% sudo droonga-engine-catalog-generate \
    --hosts=node0
% sudo service droonga-engine restart
% sudo service droonga-http-server restart
To clear effects from previous benchmark, you should restart services before each test.
After that the endpoint node0 works as a Droonga cluster with single node.
Make sure that only one node is actually detected:
(on node3)
% curl "http://node0:10042/droonga/system/status" | jq .
{
  "nodes": {
    "node0:10031/droonga": {
      "live": true
    }
  }
}
Run the benchmark.
(on node3)
% drnbench-request-response \
    --step=2 \
    --start-n-clients=0 \
    --end-n-clients=20 \
    --duration=30 \
    --interval=10 \
    --request-patterns-file=$PWD/patterns.txt \
    --default-hosts=node0 \
    --default-port=10042 \
    --output-path=$PWD/droonga-result-1node.csv
Note that the default port is changed from 10041 (Groonga’s HTTP server) to 10042 (Droonga).
Moreover, the path to the result file also changed.
And, while running, you should monitor the system status of the node0, by top or something.
It may help you to analyze what is the bottleneck.
Benchmark Droonga with two nodes
Before benchmarking, join the second node to the cluster.
(on node0, node1)
% sudo droonga-engine-catalog-generate \
    --hosts=node0,node1
% sudo service droonga-engine restart
% sudo service droonga-http-server restart
After that both endpoints node0 and node1 work as a Droonga cluster with two nodes.
Make sure that two nodes are actually detected:
(on node3)
% curl "http://node0:10042/droonga/system/status" | jq .
{
  "nodes": {
    "node0:10031/droonga": {
      "live": true
    },
    "node1:10031/droonga": {
      "live": true
    }
  }
}
Run the benchmark.
(on node3)
% drnbench-request-response \
    --step=2 \
    --start-n-clients=0 \
    --end-n-clients=20 \
    --duration=30 \
    --interval=10 \
    --request-patterns-file=$PWD/patterns.txt \
    --default-hosts=node0,node1 \
    --default-port=10042 \
    --output-path=$PWD/droonga-result-2nodes.csv
Note that two hosts are specified via the --default-hosts option.
If you send all requests to single endpoint, droonga-http-server will become a bottleneck, because it works as a single process for now.
Moreover, droonga-http-server and droonga-engine will scramble for CPU resources.
To measure the performance of your Droonga cluster effectively, you should average out CPU load per capita.
Of course, on the production environment, it should be done by a load balancer, but It’s a hassle to set up a load balancer for just benchmarking.
Instead, you can specify multiple endpoint host names as a comma-separated list for the --default-hosts option.
And, the path to the result file also changed. Don’t forget to monitor system status of both nodes also.
Benchmark Droonga with three nodes
Before benchmarking, join the last node to the cluster.
(on node0, node1)
% sudo droonga-engine-catalog-generate \
    --hosts=node0,node1,node2
% sudo service droonga-engine restart
% sudo service droonga-http-server restart
After that all endpoints node0, node1, and node2 work as a Droonga cluster with three nodes.
Make sure that three nodes are actually detected:
(on node3)
% curl "http://node0:10042/droonga/system/status" | jq .
{
  "nodes": {
    "node0:10031/droonga": {
      "live": true
    },
    "node1:10031/droonga": {
      "live": true
    },
    "node2:10031/droonga": {
      "live": true
    }
  }
}
Run the benchmark.
(on node3)
% drnbench-request-response \
    --step=2 \
    --start-n-clients=0 \
    --end-n-clients=20 \
    --duration=30 \
    --interval=10 \
    --request-patterns-file=$PWD/patterns.txt \
    --default-hosts=node0,node1,node2 \
    --default-port=10042 \
    --output-path=$PWD/droonga-result-3nodes.csv
Note that both --default-hosts and --output-path are changed again.
Monitoring of system status of all nodes is also important.
Analyze the result
OK, now you have four results:
groonga-result.csvdroonga-result-1node.csvdroonga-result-2nodes.csvdroonga-result-3nodes.csv
As described, you can analyze them.
For example, you can plot a graph from these results like:
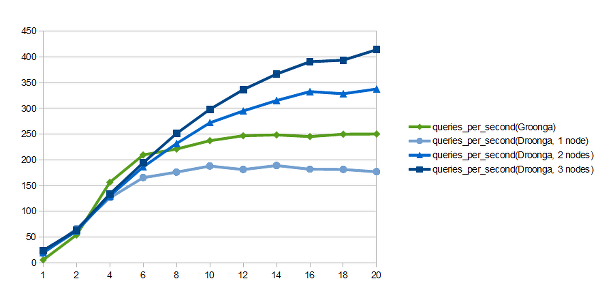
You can explain this graph as: “On this condition Droonga has better performance when there are multiple nodes”, “Single Droonga node’s performance is lesser than Groonga’s one, on this setting”, and so on.
(Note: Performance results fluctuate from various factors. This graph is just an example on a specific version, specific environment.)
Conclusion
In this tutorial, you did prepare a reference Groonga server and Droonga cluster. And, you studied how to prepare request patterns, how measure your systems, and how analyze the result.